
What Does "Inverted Yield Curve" Mean?

What is a yield curve, and what does it mean when it's inverted?
In a “normal” yield curve, long-term yields are higher than short-term yields. This makes sense because the longer someone borrows your money, the more you would expect them to pay you. But in an “inverted” yield curve, long-term yields are lower than short-term yields.
The Concept
If you are familiar with annual percentage rates on certificates of deposit (CDs), then you understand how the time premium works. The interest rate on a five-year CD is almost always higher than the rate on a one-year CD, which in turn is higher than the rate on a 30-day CD. Why?
When you put your money in a CD, you are lending it to a bank. The bank promises to pay your money back, with interest, at the end of the term. You don't know whether CD rates will move higher or lower over that term, but there's definitely more uncertainty over five years than there is over 30 days. If you lend the bank your money for five years, you want to get paid enough to compensate yourself for the fact that you might have forgone the opportunity to lend money at a higher rate before those five years are up.
Of course, the opposite scenario could play out, and rates could be lower in the future. That's why people take the bet, though the interest rates on CDs are typically pretty low compared with riskier investments, you've locked in a guaranteed return (unless you withdraw early and pay a penalty).
The Concept Applied to Bonds
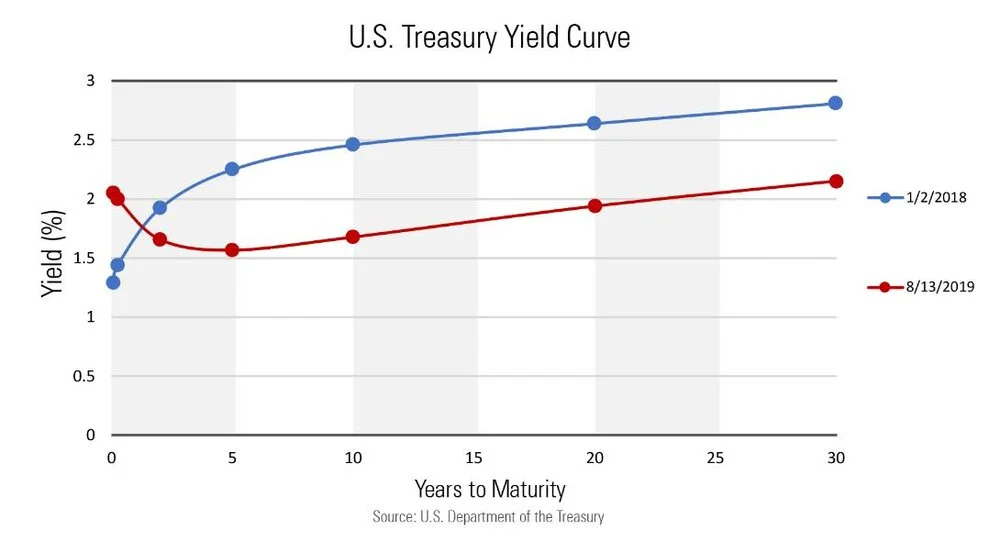
Similarly, when you invest in bonds of longer maturity, you would expect to be compensated more for lending your money for a longer period of time. Look at the two yield curves below--the blue one is from January 2018 and the orange one is from August 2019.
At the beginning of 2018, we had a more typical yield curve. If you follow the blue line, you can see that the yield on the three-month Treasury (1.4%) was appreciably lower than the yield on the 10-year bond (2.5%).
When you follow the red line, you can see that the curve has dipped negative: The yield on a three-month Treasury (at 2.0%) is higher than the yields on intermediate-term bonds (1.7%)—even 20-year Treasuries are yielding a few basis points less.
What's Going On?
It's not so difficult to understand what's going on at the short end of the curve—this is the part over which the Fed exercises more direct control. At the beginning of 2018, the Fed funds rate was at a range of 1.25%-1.50%. The Federal Reserve has raised rates four times (and lowered once) since then; the targeted range is currently 2.0%-2.25%.
What's going on at the long end of the yield curve gets complicated, though. This is the part of the curve that is more influenced by investors' expectations, including market sentiment and inflation expectations. The market has been a wild ride this year: after selling off sharply in the fourth quarter of 2018, equities have been on an upward climb in 2019; however, we've seen plenty of volatility, with a sharp sell-off in May and considerable choppiness more recently.
Inflation expectations have slackened a bit, from around 2% at the start of 2018 to 1.5% at the start of September 2019, according to the break-even inflation rate, which compares the yield on nominal Treasuries to the yield on Treasury Inflation-Protected Securities of a similar maturity to estimate the market's inflation expectations.
Also, importantly, even though the yields on Treasuries might look measly to a U.S. investor, low interest rates on global developed debt is helping to anchor the long end of the curve.
The Current Yield Curve Is Hard to Read
People fear inverted yield curves because they tend to precede recessions. This chart from the St. Louis Fed shows the spread between the 10-year and two-year Treasuries: the peaks are periods when the yield curve was steepest while the dips below the zero line indicate that the yield curve was inverted. The shaded vertical lines represent recessions (select "Max" to see a multidecade period).
To say that an inverted yield curve signals an economic slowdown is imminent is an oversimplification. It does, however, point to a risk in our current financial system: a flatter yield curve can hurt lenders' profits and stability and their willingness to lend. If long-term and short-term rates are close, markets must be expecting little growth or lenders would demand a bigger time premium.
What Can Investors Do?
Consider checking in on whether your portfolio is well positioned to weather a rough patch. You may choose to invest assets needed to fund near-term living expenses in cash and other safe, liquid short-term assets. Regardless of what’s going on the market, it’s important to ensure that your investments align with your personal risk tolerance and retirement goals. To discuss the DCP’s retirement options with a Retirement Local Counselor, contact us.
Source: Morningstar.com